
Process map
How to read the map, change its detail, click a step, and export it as BPMN.
The map shows how the work really moves, step by step, including the detours and the steps that get done twice.
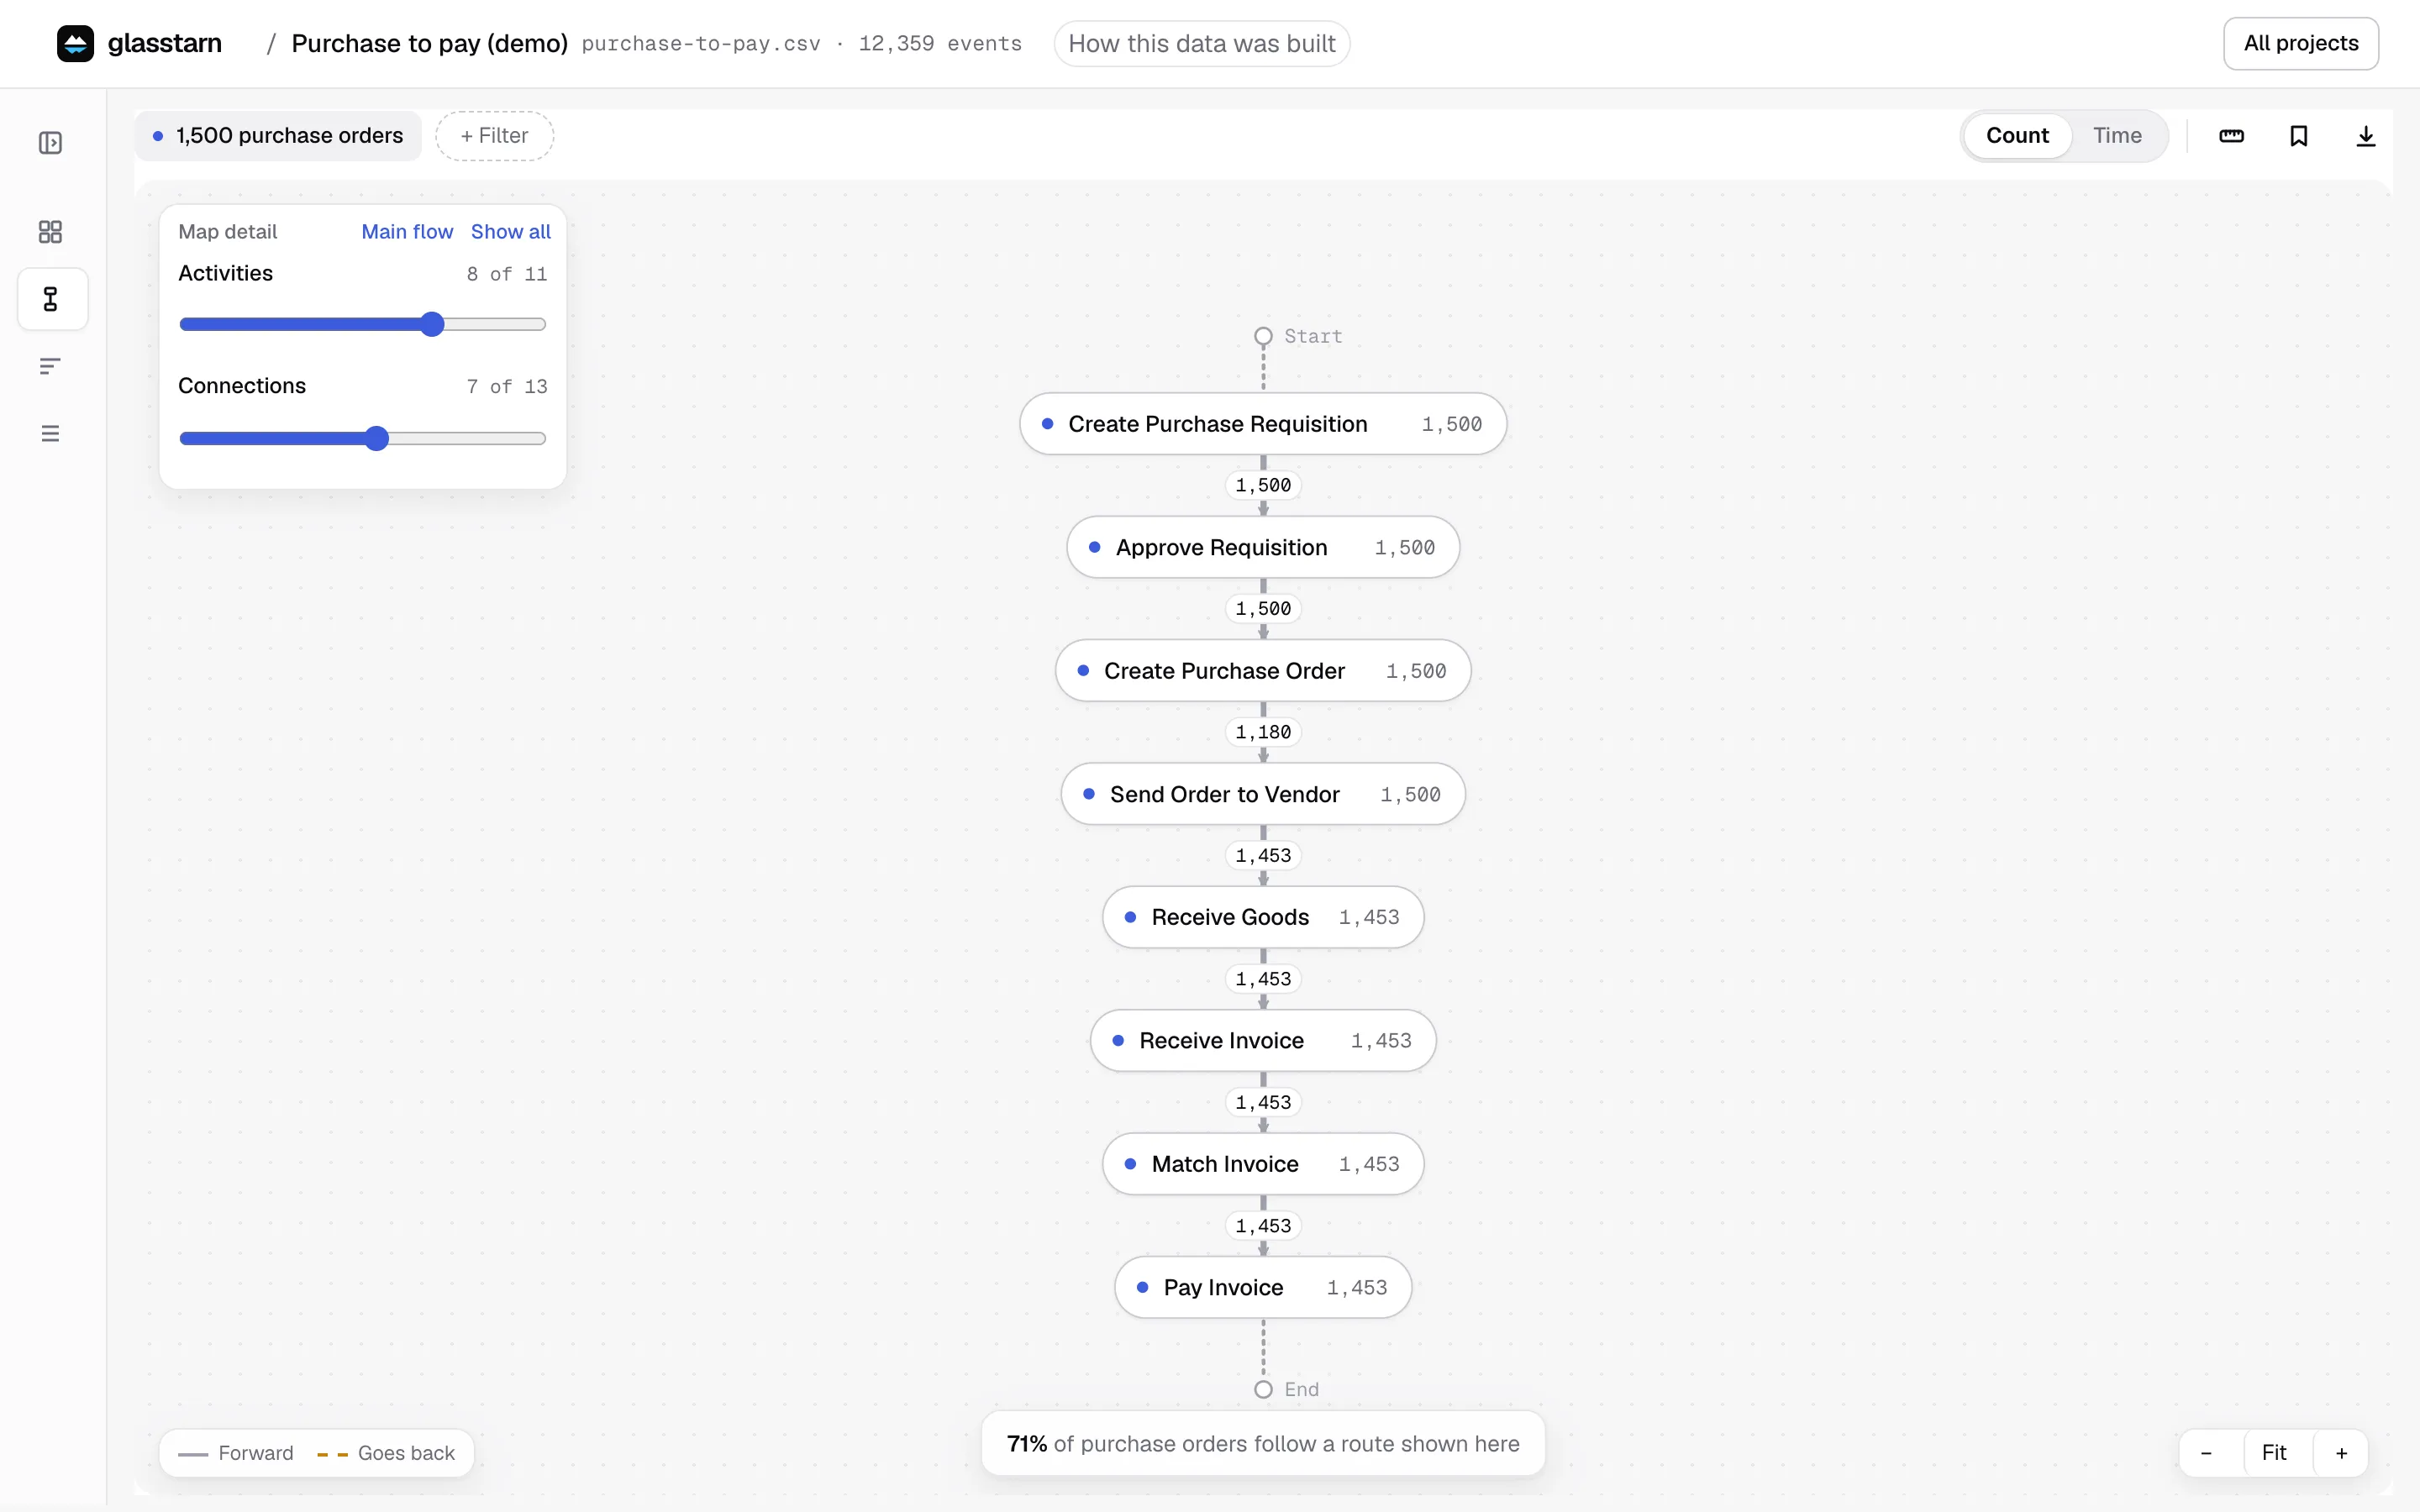
Every box is a step, and every arrow is a hand-off from one step to the next.
The map, and the subway for linked records
Section titled “The map, and the subway for linked records”For one kind of item, such as invoices or claims, the map draws steps as slim pills with thin curved arrows.
When your project has linked records, such as orders with their deliveries, invoices and payments, a switch appears at the top of the map: Classic draws one kind of record at a time, and Subway draws every kind as its own coloured line, like a metro map, meeting where they share a step. The subway exists only for linked records. See Connected processes.
Count or time
Section titled “Count or time”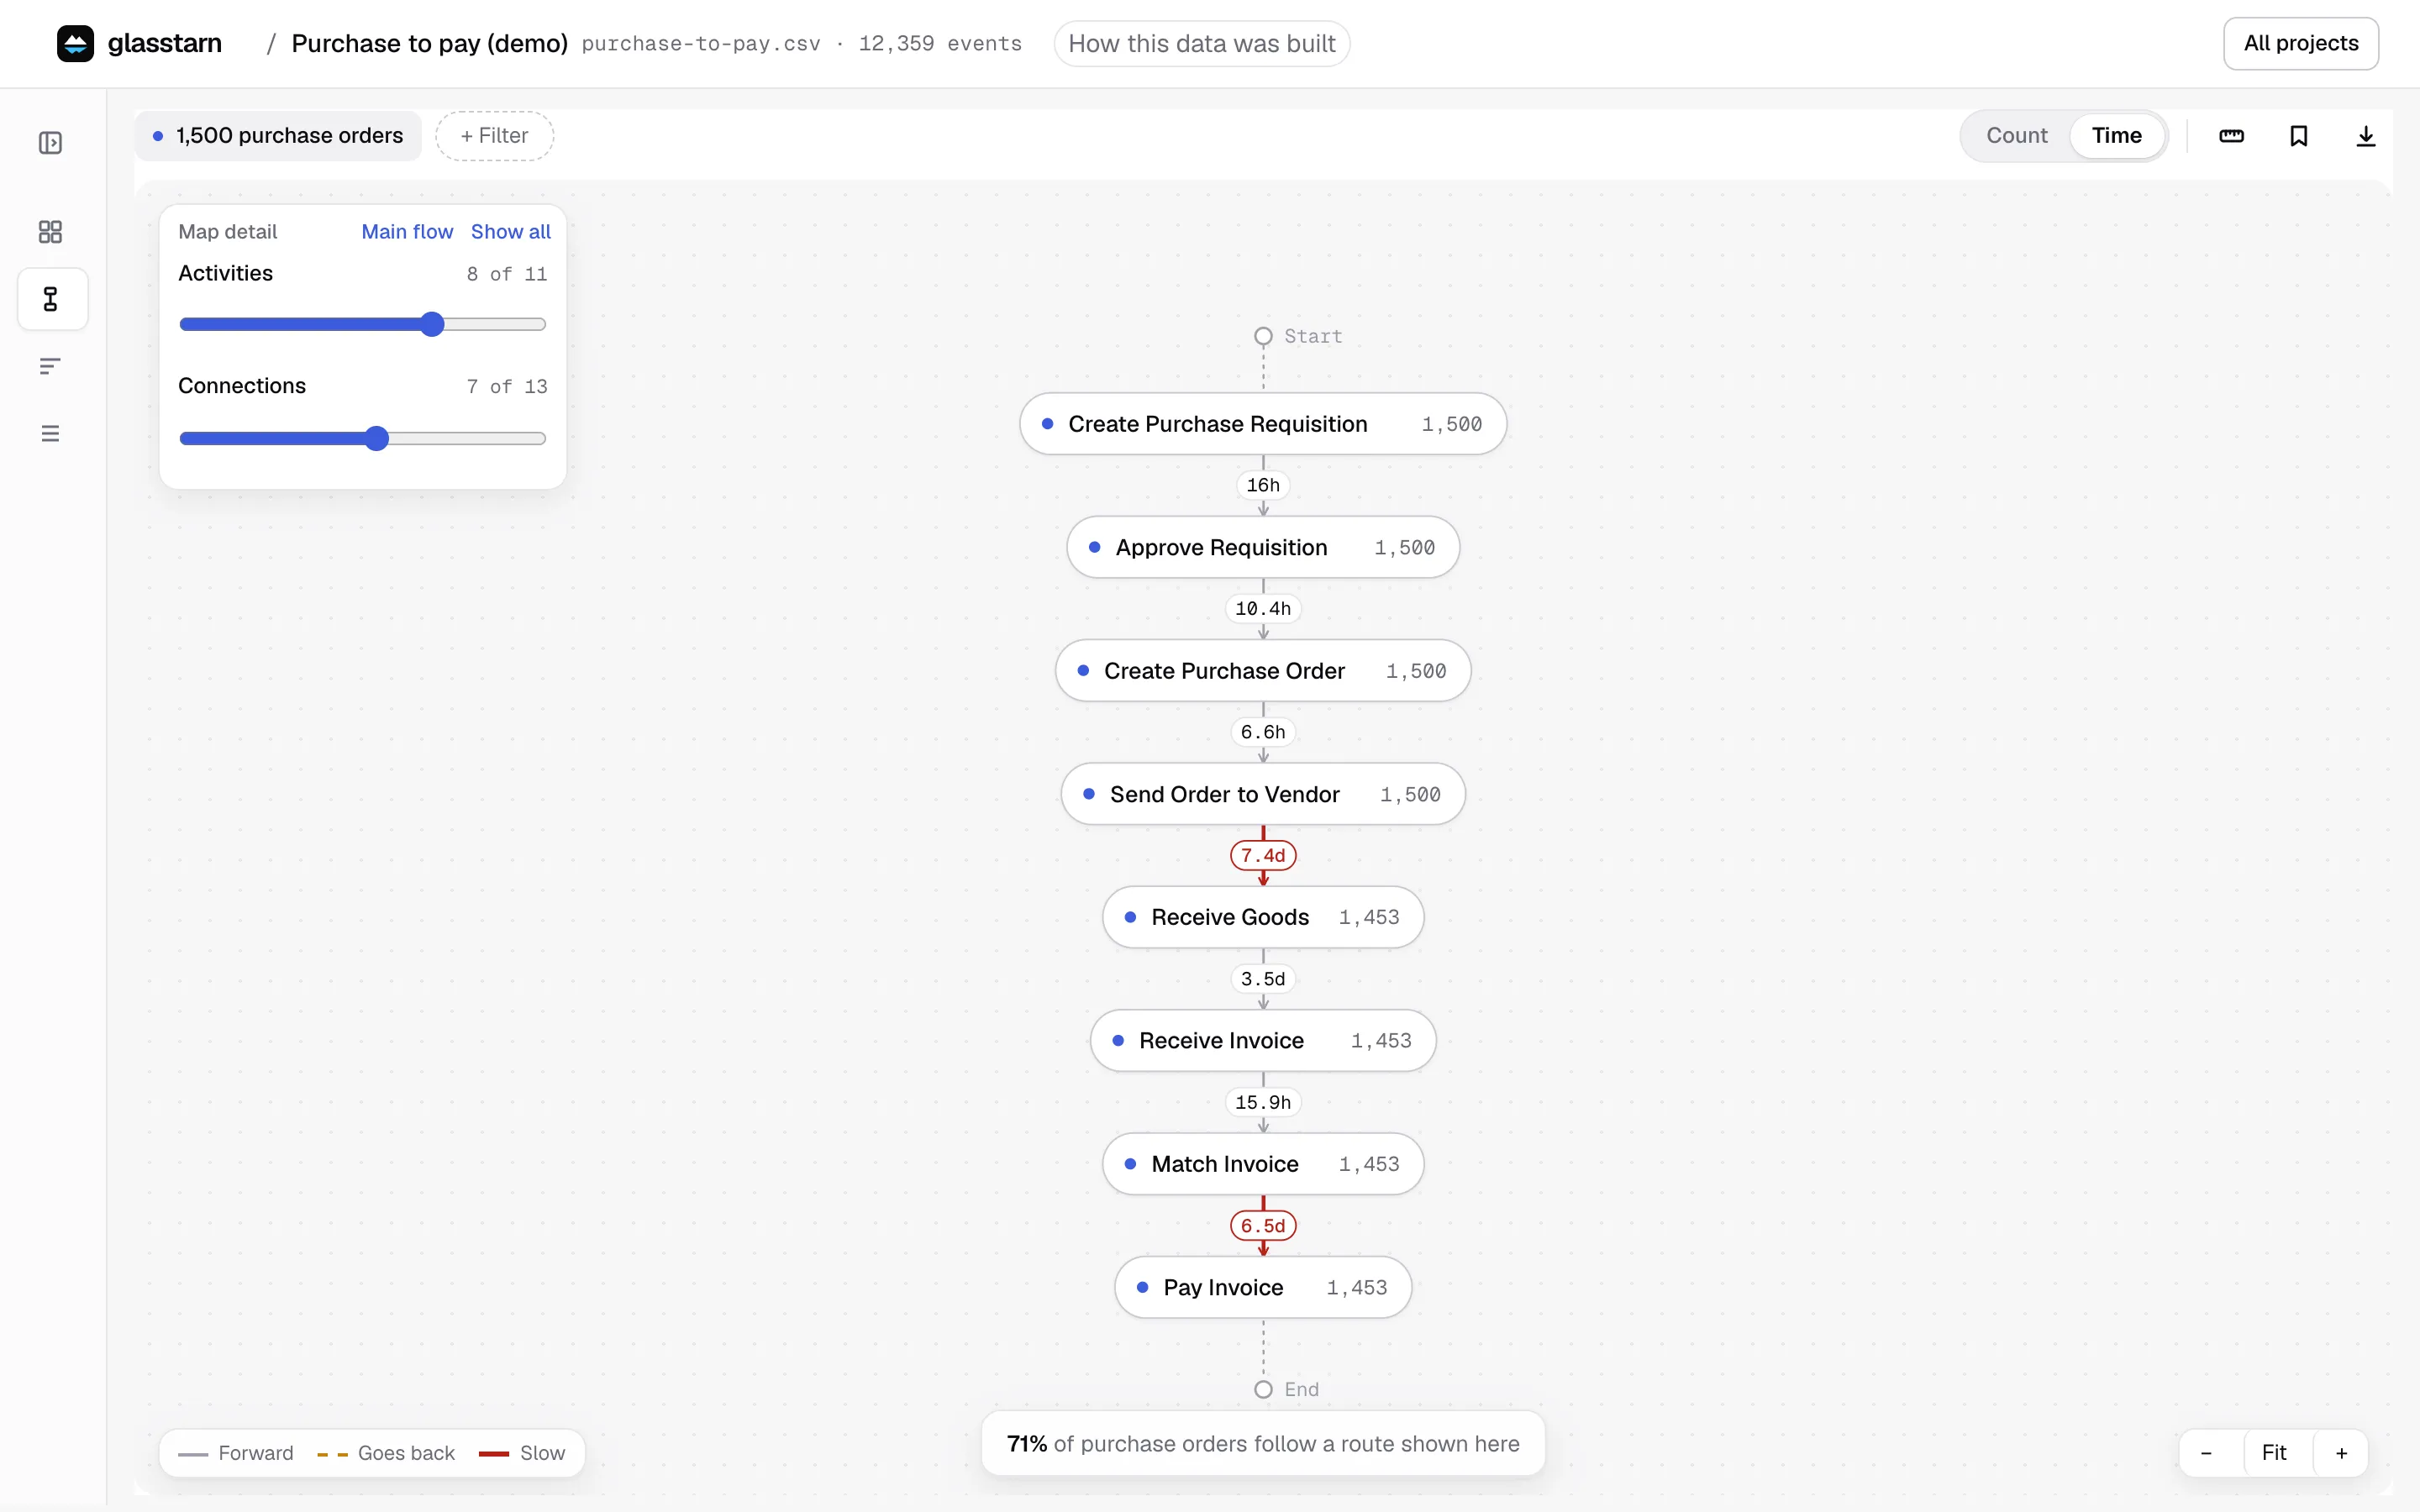
- Count puts the number of work items on each arrow.
- Time puts the average time each hand-off takes, and marks the slow ones in red.
Reading the arrows
Section titled “Reading the arrows”The legend under the map explains the line styles:
| Line | Meaning |
|---|---|
| Forward (solid) | Work moving on to the next step |
| Goes back (dashed amber) | Work returning to an earlier step: rework |
| Slow (red, in Time) | A hand-off that is much slower than the rest |
Thicker lines carry more work items.
The line above the map tells you how much of the work you are seeing, for example 43% of work items follow a route shown here. If that number is low, the map is hiding a lot. Show more detail.
Showing more or less
Section titled “Showing more or less”Real processes are messy. A process with 40 steps can have hundreds of different hand-offs, and drawing all of them at once gives you spaghetti. So the map starts simple and lets you add detail. Use the Map detail box at the top left of the map.
Activities (the steps). The slider says how many steps are drawn, for example 8 of 11. Steps are added in order of how common they are.
- Drag it left to see only the steps almost every item goes through.
- Drag it right to add the rarer steps, such as Change Price or Cancel Order. These are often where the exceptions and the rework hide.
Connections (the arrows). The slider says how many hand-offs are drawn, for example 7 of 13. Arrows are also added most common first.
- Drag it left for the main path only.
- Drag it right to add the less common routes: steps that are skipped, done in a different order, or done again. Dashed amber arrows that appear are work going back.
Main flow sets both sliders to show the backbone. Show all draws every step and every arrow.
A good habit: start with Main flow, then drag Connections to the right a little at a time and watch which arrows appear. Each new arrow is a different way the work actually happens.
The line under the map, such as 71% of purchase orders follow a route shown here, goes up as you add detail. If it is low, a lot of the work takes routes you are not seeing yet.
Hiding a step from the map does not remove it from the numbers. Counts always use every work item in your current filter.
With linked records, in Subway you can pick one line. Then Variants and Items follow that line too, on every page. A chip shows it, and Clear all brings everything back.
Clicking a step
Section titled “Clicking a step”Click any step to open its panel on the right:
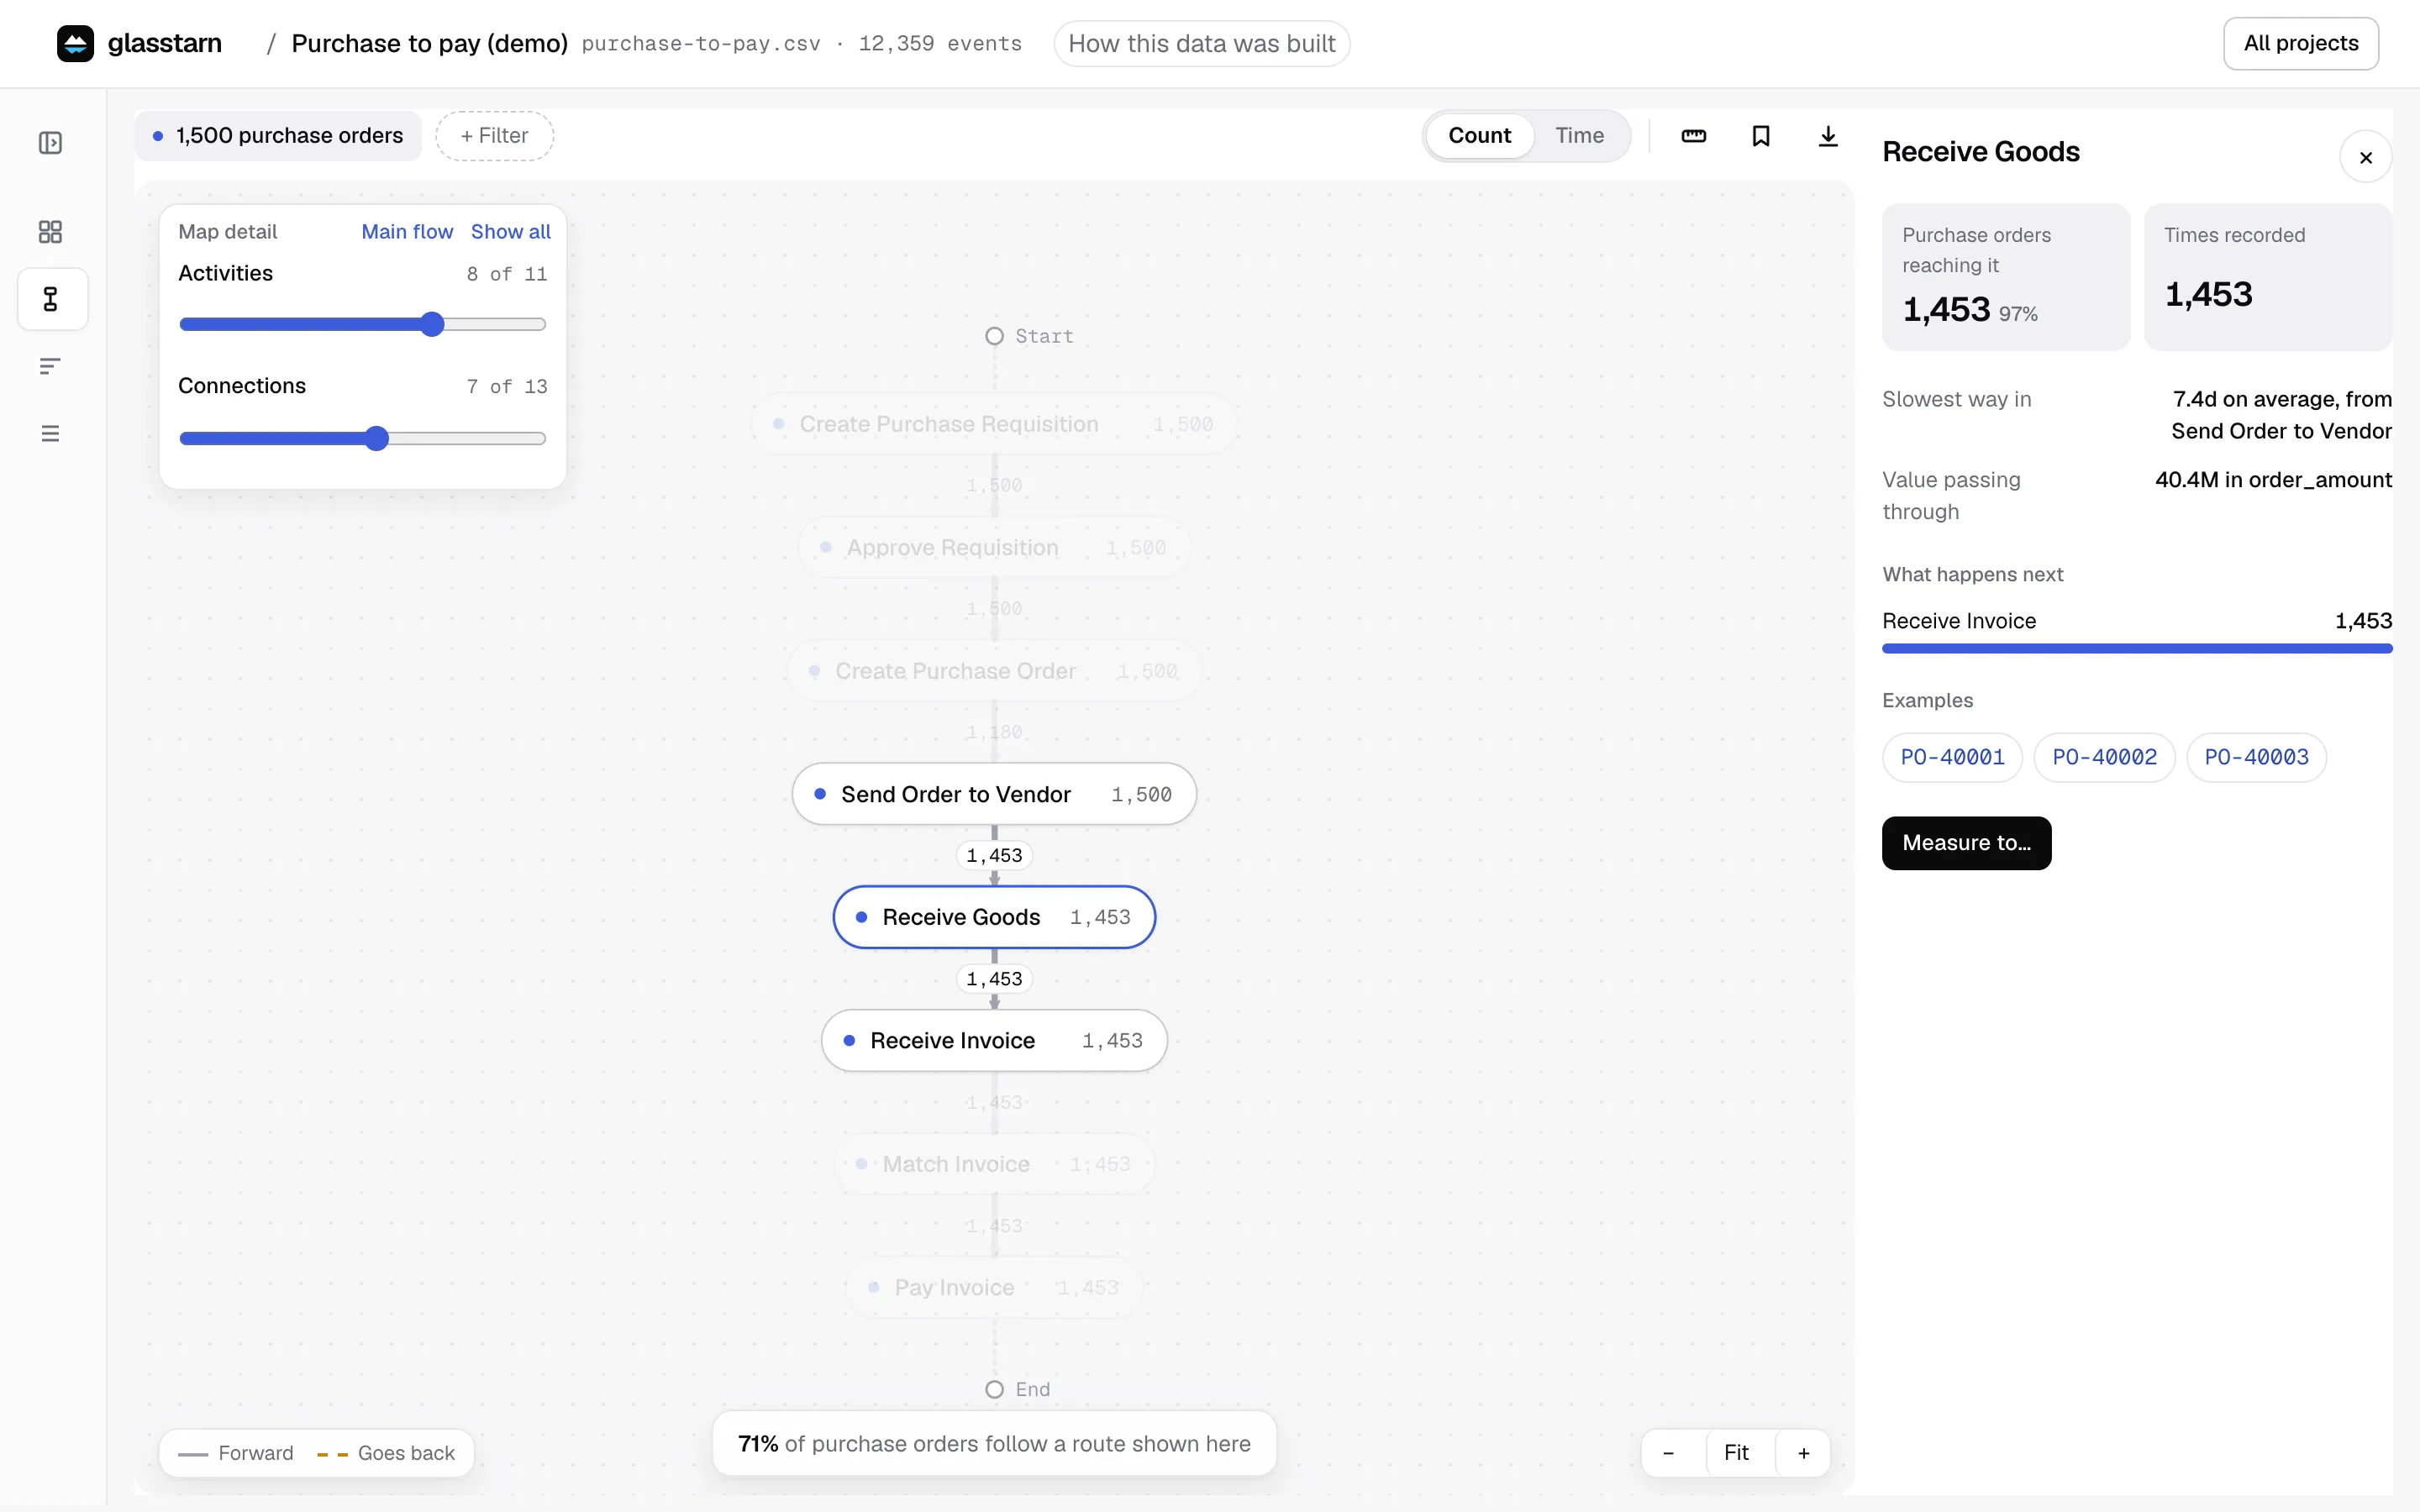
| Field | Meaning |
|---|---|
| Items reaching it (for example Claims reaching it) | How many items did this step at least once, and their share of all items |
| Times recorded | How many times it was done in total. Higher than the line above means it repeats |
| Slowest way in | The hand-off into this step that takes longest on average |
| Value passing through | Only when your data has an amount: the total amount of the items that reach this step |
| What happens next | Where work goes after this step, with counts |
| Examples | A few real items. Click one to see its full history |
| Measure to… | Start timing from this step. See Measure |
Saving and exporting
Section titled “Saving and exporting”- Saved views (bookmark icon) stores the map as it is now with Save view: layout, detail and filters. Reopen it from the same icon later.
- Export BPMN saves the map as a BPMN 2.0 file with its layout, for tools that read BPMN. With linked records it works from Classic; in Subway the button says Switch to Classic to export as BPMN. Your agent can also export it for you, with the items and routes as spreadsheets: ask “export the process map”. See BPMN and before and after.